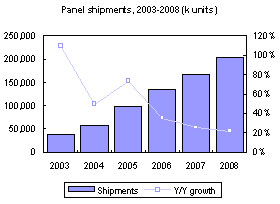
 After experiencing a gloomy period of large-size panel oversupply in mid-2004, Taiwan-based large-size TFT LCD makers recovered in 2005. The top five panel makers in Taiwan, along with Innolux Display and Toppoly Optoelectronics, saw their shipments of large-size panels reach 99.345 million units, up 73.2% from 2004.
Chart 5: Monitor panel shipments by size, 4Q04-4Q05 (k units)
Chart 6: Monitor panel shipment proportion by size, 4Q04-4Q05
Chart 7: Notebook panel shipments by size, 4Q04-4Q05 (k units)
Chart 8: Notebook panel shipment proportion by size, 4Q04-4Q05
Chart 11: Taiwan large-size panel shipments and global share, 2001-2005 (k panels)
Table 1: Global large-size TFT LCD shipment percentage breakdown by region, 2005
Table 2: Global large-size TFT LCD shipment breakdown by region, 2005 (k units)
Chart 13: Taiwan panel makers’ profits and losses, 1H05 (NT$m)
Table 3: Major increase in large-size TFT LCD capacity, 2006 (k substrates/month)
Achieving shipment goals will depend on ability to secure key components
Innovations in key components and production from South Korea and Japan?
Chart 14: Taiwan large-size TFT LCD shipments, 1Q05-1Q06 (k units)
Chart 15: Panel shipments by application, 2Q04-4Q05 (k units)


