Introduction
Review and forecast
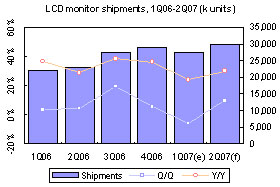
Shipments
Chart 1: LCD monitor shipments, 1Q06-2Q07 (k units)
Production value
Chart 2: Production value, 1Q06-1Q07 (US$m)
Market share
Chart 3: Worldwide market share, 1Q06-2Q07
Shipment concentration
Chart 4: Top-5 makers’ share of shipments, 1Q06-1Q07
OBM, OEM/ODM breakdown
Chart 5: Shipment share by production mode, 1Q06-1Q07
Screen size
Chart 6: LCD monitor share by screen size, 1Q06-2Q07
Chart 7: LCD monitor shipments by screen size, 1Q06-2Q06
Chart 8: Shipment share, 19-inch-and-larger segments, 4Q06-2Q7
Industry watch
Monitor ASPs down in 1Q, but panel pricing rebounds in 2Q
Chart 9: ASPs for LCD monitor segments, 1Q07 (US$)
Competing for orders from Korean vendors
Rising TV panel demand in 2H07 may affect monitor panel capacity
19-inch widescreen segment takes off
Table 1: Widescreen LCD monitor panel cuts, by substrate generation
Shipments through 2009
Chart 10: Global LCD monitor shipments, 2005-2009 (k units)