In the fourth quarter of 2011, worldwide sales of branded tablet devices saw zero growth amid a global economic downturn. Many started wondering whether the tablet market was already maturing. However, Digitimes Research's analysis shows that the fourth-quarter zero growth was a special case resulting from the double impacts of the March 11 disasters in Japan and the weak economy. They are not expected to hinder the future of tablet devices.
The global economic situation does not seem too pessimistic in 2012. Demand for mobile computing will rise steadily and the price-performance ratio of tablet devices will improve. And there will be improvements to the software and hardware support for Android-based tablets. These factors all contribute to a 60% growth in tablet shipments to 95.10 million units in 2012. Digitimes Research defines shipments as devices shipped from ODM/OEM partners to brand partners. Brand vendors' shipments to channels are not taken into consideration.
After a year of trials and tribulations in 2011, capable vendors have already established firm places in the global tablet device market. Digitimes Research has examined 13 major tablet brands worldwide, predicted their shipments in 2012, and assessed the importance of tablet devices in these vendors' overall product lines.
Inside the Top-3 camp, the king - Apple - has shown its bottleneck. Its strategy of one model per year undermined its sales momentum in the fourth quarter of 2011, while competitor Amazon enjoyed brisk sales during the hot season. Samsung Electronics was in a neck-and-neck race with Apple in both smartphone and notebook sales. Samsung's next target is the tablet market, and its shipments stand a chance of hitting 10 million units.
Within the camp comprising Apple's competitors, Samsung, PC and e-book vendors will form three major forces in the tablet market. Major PC vendors in the tablet market include Lenovo, Acer and Asustek Computer, with each of them shipping 2.5-3 million tablet devices, or almost 10% of their overall shipments. Handset vendors' tablet shipments are mostly be less than 2 million units each, sharing less than 5% of their overall shipments. Among e-book reader vendors, Amazon still leads Barnes & Noble by a wide margin, but their proportion of tablets will both still be at least 30% of their overall shipments.
Netbooks have led the mobile computing sector through the storm of the financial crisis
Chart 1: Mobile computing device shipments, 2007-2011 (k units)
Chart 2: Breakdown of mobile computing device shipments by type, 2008-2011
Chart 3: Quarterly global shipments of branded tablets, 2010-2011 (m units)
Chart 4: Global market share for branded tablet operating systems in 2011
Chart 5: Global shipment share of branded tablets by screen size, 2011
Chart 6: Global shipments of branded tablets by screen size, 2011
Chart 7: Rankings of major branded tablets by global shipments in 2011
Chart 9: Market share for Taiwan-based tablet ODM/OEM firms in 2011
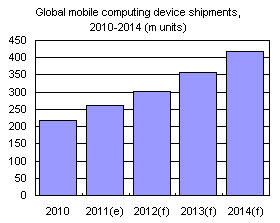
Chart 12: Global shipment forecast of mobile computing devices, 2010-2014 (m units)
Chart 13: Annual growth rates of tablet and other mobile devices, 2008-2012 (%)
Chart 15: Global shipment breakdwon of mobile computing devices by type, 2010-2014
Chart 16: Other vendors will launch 1,920x1,200 hi-res models to compete with new hi-res iPads
Chart 17: Materials costs and US retail prices for 7-inch and 10-inch 16GB Wi-Fi tablet models
Chart 19: Global shipments of mobile computing devices, 2010-2014
Chart 20: Global tablet OS market share projections for 2012
Chart 21: Android shipments overtake the iPhone 2 years after the launch of Android
Chart 22: Tablet shipments for major global brands, 2011-2012 (m units)
Chart 23: Apple tablet shipments and shipment breakdown by product, 2010-2012 (m units)
Chart 24: Samsung tablet shipments and shipment breakdown by product, 2010-2012 (m units)
Chart 25: Sony tablet shipments and shipment breakdown by product, 2010-2012 (m units)
Chart 26: RIM tablet shipments and shipment breakdown by product, 2010-2012 (m units)
Chart 27: HTC tablet shipments and shipment breakdown by product, 2010-2012 (m units)
Chart 28: Motorola tablet shipments and shipment breakdown by product, 2010-2012 (m units)
Chart 29: Lenovo tablet shipments and shipment breakdown by product, 2010-2012 (m units)
Chart 30: Acer tablet shipments and shipment breakdown by product, 2010-2012 (m units)
Chart 31: Asus tablet shipments and shipment breakdown by product, 2010-2012 (m units)
Chart 32: HP tablet shipments and shipment breakdown by product, 2010-2012 (m units)
Chart 33: Dell tablet shipments and shipment breakdown by product, 2010-2012 (m units)
Chart 34: Amazon tablet shipments and shipment breakdown by product, 2010-2012 (m units)
Chart 35: Barnes & Noble tablet shipments and shipment breakdown by product, 2010-2012 (m units)

