With the cost of developing a new semiconductor fab anticipated to surpass US$5.0 billion by 2015, more and more IDMs are adopting a fab-lite outsourcing model. The growth in the merchant foundry industry has also provided fabless IC design firms with access to reasonably-priced advanced-process capacity without the need for huge capital expenditure, and IC design has therefore grown as a share of the semiconductor market to 25.8%, up from less than 10% in 2000.
This Digitimes Special report focuses on how the foundry sector supports IC design customers through design services and trends among the key industry design platforms.
Chart 1: Cost structure of IC design projects by process node (US$m)
Chart 3: Photomask costs have increased massively for advanced processes (US$m)
Chart 4: Embedded software support for multiple platforms is already a necessity
Chart 6: Comparison of IC design project numbers with the evolution of process nodes
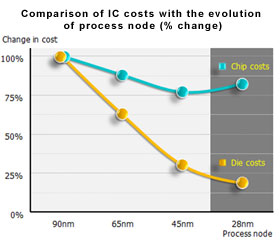
Chart 7: Comparison of IC costs with the evolution of process node (% change)
Chart 8: Design concepts of Apple's A4 processor architecture
Chart 10: Collaborative development effectively shortens the development process for devices
Chart 13: Semiconductor process technology versus factory construction costs (US$b)
Chart 14: Date of announcement of global IDM's asset-lighting strategies
Chart 16: IC design output value and share of the semiconductor market, 2007-2011 (US$b)
Chart 20: Merchant foundries' strategies for client selection and resource allocation
Chart 21: Taiwan IC design service industry value and growth, 2007-2011 (NT$b)
Chart 23: Share of Taiwan IC design service industry by product sectors, 2011
Chart 24: Share of Taiwan IC design service industry by application sector, 2011
Chart 25: Share of Taiwan IC design service industry by sales region, 2011
Chart 26: Share of Taiwan IC design service industry by process technology, 2011
Chart 27: Taiwan IC design industry chain and associated companies
Breakdown of revenues for Taiwan IC design service companies
Chart 28: Revenue share among companies in the Taiwan IC design service industry
Chart 29: Process platforms of the major global merchant foundries
Chart 30: Platform processes of Taiwan's major IC design service firms
Revenue distribution for the process platforms of Taiwan-based IC design service providers
Chart 31: Process platform share in the Taiwan IC design service industry, 2011
Chart 32: Evolution of Global Unichip's process technology and manufacturing service suppliers
Chart 35: Global Unichip's 2011 revenue share by application sector
Chart 36: Global Unichip's 2011 revenue share by sales region
Chart 37: Global Unichip's 2011 revenue share by process technology
Chart 38: Evolution of Alchip's process technology and manufacturing service suppliers
Chart 44: Evolution of Progate's process technology and manufacturing service suppliers
Chart 46: Overview of Goyatek's history and manufacturing service suppliers
Chart 48: Evolution of Faraday's process technology and manufacturing service suppliers
Chart 51: Faraday's 2011 revenue share by application sector
Chart 53: Faraday's 2011 revenue share by process technology
Chart 54: Overview of Socle's history and manufacturing service suppliers
Chart 55: Share of 12-inch wafer capacity among foundries on the Common Platform, 2011
Chart 56: CoAsia's main operations and manufacturing service suppliers
Chart 57: IC design services as share of CoAsia's revenues, 2007-2011 (NT$b)
Chart 58: Comparison of the evolution of process technology for foundries and IC design services
28nm design projects and 40nm manufacturing services will be the main growth drivers in 2012
Chart 60: Comparison of the evolution of process technology and the number of design projects
Chart 61: Global share of merchant foundry 12-inch capacity by platform, 2011
Chart 62: Process platforms in the Taiwan IC design service industry

