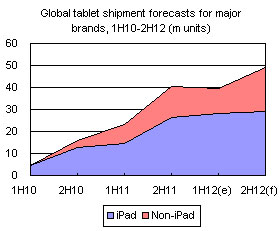
In the second half of 2012, poor global economic growth is having a more significant impact on the global market for branded tablets than had previously been anticipated. Digitimes Research therefore remains conservative about the prospects for the period, with half-year shipments projected to reach 49.18 million units and whole-year shipments being revised downward to 88.69 million units; the ratio of shipments between the first and second halves of the year is estimated to be 45:55.
The ranks of competitors in the tablet market will see enormous changes in 2012. Where the market formerly consisted mainly of mobile phone and PC vendors versus Apple, the situation is evolving so that four major players will fight for the spoils: Amazon, Google, Microsoft and Apple. This battle among industry giants will be the key to the development of the industry over the second half of 2012.
Shipments of 12 million iPad 2 tablets in the first half of 2012 and the launch of the Google-Asus Nexus 7 in the third quarter have had a significant impact on other tablet manufacturers. This will be followed by the launch of Amazon's next-generation 7-inch tablets and the Microsoft Surface, while there is also the possibility that Apple will launch a smaller iPad - likely to be dubbed the iPad Mini - and/or a refreshed version of its main 9.7-inch iPad model, hereafter referred to as the "refreshed iPad".
Digitimes Research forecasts that total shipments for the aforementioned four main players in the second half of 2012 will reach 38.5 million units, with figures for Google based on the part of Nexus 7 shipments which will be sold via Google Play, i.e. excluding the portion of Nexus 7 shipments sold through Asus' sales channels. This figure would exceed total global shipments of branded tablets during the first half of 2012 and account for some 77% of overall shipments in the period.
While Android has overtaken iOS as the largest platform in the smartphone market, it has been far less successful in the tablet sector, with OEM partners dropping out with each successive quarter, and the launch of the Kindle Fire in fourth-quarter 2011 also took a further slice of the potential opportunities for developing low-end tablets running official Android.
Figures from Digitimes Research show that shipments of branded tablets running official Android began to stagnate from the second quarter of 2011, with quarterly shipments failing to break the four-million barrier. Andy Rubin indicated in October 2011 that just six million Android tablets had been activated, highlighting the fact that sales of Android tablets from brand vendors have been far from ideal.
Chart 1: Apple iPad and other branded global tablet shipments, 1H12 (m units)
Chart 2: Breakdown of global branded tablet shipments in 1H12
Chart 4: Kindle Fire and other Android tablet shipments, 2H11-1H12 (m units)
Chart 5: Global shipments of branded tablets by AP, 2H11-1H12 (m units)
Chart 6: Global shipments of tablets for major brands, 1H11-1H12 (m units)
Chart 7: Tablet shipments for Taiwan-based manufacturers, 1H11-1H12 (m units)
Chart 8: Shipments of branded tablets running official and unofficial versions of Android (m units)
Chart 9: 2H12 Nexus 7 monthly shipment forecas, 2H12 (k units)
Chart 10: Estimated revenue and profit for the Kindle Fire (US$)
Chart 11: Estimated revenue and profit for the Kindle Fire Low Cost (US$)
Chart 12: Amazon tablet monthly shipment forecast, 2H12 (k units)
Chart 13: Amazon Kindle annual device shipment, 2008-2012 (m units)
Chart 14: Overall tablet and Microsoft Windows tablet shipments, 2012-2015 (m units)
Chart 15: Microsoft Surface monthly shipment forecasts (k units)
Chart 16: Apple tablet shipments by market segment, 2012 (m units)
Chart 17: Quarterly shipments of iPad 2 and 9-inch+ non-iPads, 2012 (m units)
Table 4: Key factors affecting 2H12 shipments for major global tablet brands
Chart 19: Global tablet shipment forecasts for major brands, 1H10-2H12 (m units)
Almost half of 2H12 shipments accounted for by smaller devices
Chart 20: Small/medium-size tablet shipments and share of shipments, 1H11-2H12 (m units)
Chart 21: Small/medium-size branded tablet shipments, 1H11-2H12 (m units)
Large tablet shipment drop will become more pronounced in 2H12
Chart 22: Large branded tablet shipments and share of shipments, 1H11-2H12 (m units)
Chart 23: Large tablet shipments by brand, 1H11-2H12 (m units)
Chart 24: Global branded tablet shipments by OS, 1H11-2H12 (m units)
Chart 25: Share of global branded tablet shipments by OS platform, 1H11-2H12
Nexus 7 will push e-reader vendors' share of Android tablet shipments below 40%
Chart 26: Share of global branded Android tablet shipments by brand, 2H12
Microsoft will account for 45% of Windows branded tablet shipments in 2H12
Chart 27: Share of global branded Windows tablet shipments, 2H12
Chart 28: Global detachable tablet shipments and share of shipments, 1H11-2H12 (k units)
Chart 29: Global branded tablet shipments by AP supplier, 1H11-2H12 (m chips)
Chart 30: Global branded tablet shipments by brand, 1H11-2H12 (m units)
Chart 31: Global tablet shipments by brand, 2011-2012 (m units)
Chart 32: Share of tablet shipments for the top five vendors in 2012
Chart 33: shipments and share of shipments for Taiwan-based manufacturers, 1H11-2H12 (m units)
Chart 34: Taiwan tablet shipments by manufacturer, 1H11-2H12 (m units)

