

Subscribe to Research Taiwan FPD Tracker or Taiwan Display System Tracker to read this report or purchase it separately. Subscribe Now
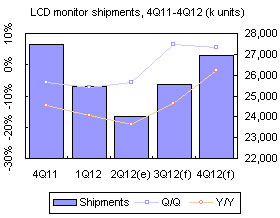 Taiwan's LCD monitor shipments declined 5.6% sequentially and 19.0% on year to reach 24.01 million units in the second quarter of 2012.