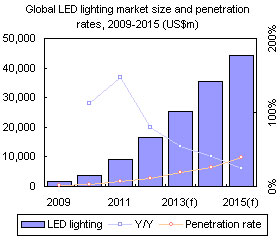
Digitimes Research forecasts that the global LED lighting market will be worth US$25.4 billion in 2013, representing 54% growth on the 2012 figure of US$16.5 billion, while the LED lighting penetration rate will also rise to 18.6%. In terms of technological improvements, the luminous efficacy of LEDs compared to traditional lighting continues to rise. Given that the US Department of Energy (DoE) development targets were set at 129 lm/W for warm white light LEDs and 164 lm/W for cold white light LEDs, a quick look at the track record of many manufacturers shows that the industry has surpassed the brightness standards set out in the DoE targets every year since their inception.
LED lighting product prices are likely to drop by 20-25% in 2013, as LED component performance/price ratios rise from 2012's 500 lm/US$ to 1,000 lm/US$ in 2013.
Looking further ahead to 2015, the US DoE targets are for LED component costs to drop 37% from 2013 levels, while 60W-equivalent LED bulb costs are to drop by 38% from 2013 levels by 2015. Assuming this is the case, LED lighting prices will then be at a price point even more acceptable to general consumers.
Lighting policy in many countries is also critical to the development of LED lighting, and this effect has been most marked in the Asia region. For example, Japan now has the highest LED lighting market penetration rate of any region, with the rate set to rise to 73.8% by 2015; South Korea's Korea Association for Photonics Industry Development (KAPID) projects that the country's LED lighting industry will have an output value of US$7.8 billion by 2015, 5.6 times the figure for 2012; while China's LED lighting market is growing by 30% per year, which will give the country nearly one third of total global output value for LED lighting in 2015.
All of these factors are driving major growth in the LED lighting market. Digitimes Research therefore projects that the global LED lighting market will be worth US$44.2 billion in 2015, while the market penetration rate will reach 38.6%.
Chart 1: Global high-brightness LED market size, 2009-2015 (US$)
Chart 2: High-brightness LED revenue breakdown by application, 2009-2013
Chart 3: Global LED lighting market size and penetration rate, 2009-2015 (US$)
Table 1: Lighting policies and key figures for markets in major global regions
Chart 4: Average market prices for 40W/60W-equivalent LED bulbs in the 4 main global regions (US$)
Chart 5: Average market prices for 40W/60W-equivalent LED bulbs in Japan (JPY)
Chart 6: Average market prices for 40W/60W-equivalent LED bulbs in South Korea (KRW)
Chart 7: Average market prices for 40W/60W-equivalent LED bulbs in the US (US$)
Chart 8: Average market prices for 40W/60W-equivalent LED bulbs in Europe (EUR)
Chart 10: LED lighting revenues and growth rates for major manufacturers, 2012-2013 (US$m)
Chart 11: 2013 market share forecasts for major global LED lighting manufacturers
Table 2: Market presence of the major global LED lighting manufacturers
Table 3: Industry chain distribution analysis for major global LED lighting manufacturers
Table 4: Comparison of the operations and presence of major US LED lighting makers Cree and Acuitity
Chart 12: Cree's revenues and profit margin rates, 2007-2013 (US$)
Chart 13: Breakdown of Cree's revenues by product category, 2008-2013
Table 5: Overview of Cree's upstream LED suppliers by region
Chart 15: Luminous efficacy and production status of Cree's high-power white light LEDs (lm/W)
Chart 16: Acuity's lighting revenues and profit margin rates, Fiscal 2008-2013 (US$)
Chart 17: Share of Acuity's revenues accounted for by LED lighting, Fiscal 2011-2013
Table 7: Overview of Acuity's downstream industry chain and presence
Chart 19: Acuity's capital expenditure, Fiscal 2008-2013 (US$)
Europe's major lighting manufacturers - Philips, Osram and Zumtobel
Table 8: Comparison of the operations and market presence of Europe's major lighting manufacturers
Chart 20: Revenue and profit for Philips' lighting division, 2008-2013 (EURm)
Chart 21: Prices of rare earth materials used in phosphors, January-December 2012 (US$/kg)
Chart 22: Philips lighting sales by application sector, 2012
Chart 24: Proportion of Philips R&D investment spend on digital smart lighting, 2008-2015
Chart 26: Revenues for Osram's lighting-releated business sections, 2011-2013
Table 9: Global industry position of Osram's LED business, 2012
Chart 28: Osram's projected compound annual growth rates for sales in major regions, 2010-2016
Table 10: LED industry vertical integration value chain for Osram
Chart 29: Zumtobel's revenues and profit margin rates, 2008-2014 (EURm)
Chart 30: LED lighting as a proportion of Zumtobel's revenues, 2012-2014
Japan's major lighting manufacturers - Panasonic and Toshiba
Chart 32: Panasonic's total LED lighting revenues, 2011-2015 (JPYb)
Chart 33: Overseas revenues and share of total revenues for Panasonic LED lighting, 2012-2015 (JPYb)
Chart 34: Panasonic's regional targets for share of overseas LED lighting sales in 2015 (JPYb)
Chart 35: LED lighting uptake rates for different application sectors in Japan, EoY 2012
Chart 36: Toshiba Lightech's total LED lighting revenues, 2010-2015 (JPYb)
Table 12: Toshiba Corporation's upstream involvement in the LED industry
South Korean lighting manufacturers - Samsung Group and LG Group
Table 14: Industry presence and supply chains for Samsung Electronics and LG Electronics
Chart 37: Samsung Group's 5 major business areas for development by 2020
Table 15: Samsung Electronics' LED lighting market presence in South Korea and abroad
Table 16: Samsung Electronics' new LED light bulbs and MR16 lights
Table 17: Features of Samsung's AILS intelligent vehicle headlight system
Chart 39: LG Innotek's lighting LED revenues, 2011-2013 (KRWb)
Table 19: LG Electronics and LG Innotek's LED lighting market presence in South Korea and abroad

