The China flat panel industry has been booming in recent years as demand for consumer devices has been on the rise in China and local panel makers have also received both government financial support and tariff benefits. With consumer demand expected to remain strong in China, local makers are expanding their production capacity and increasing their utilization rates, allowing some local first-tier makers to achieve profit levels approaching that of leading global panel makers.
This Digitimes Research Special Report analyzes the trends affecting China's flat panel makers in terms of their customers, production capacity and technology trends from 2013-2016, and also provides an analysis of the progress for self-sufficiency by the makers, in accordance with local government financial support.
Chart 1: Changes in China's LCD panel imports and exports from 2007-1H13 (CNYbillion)
Chart 2: TFT LCD production capacity in China by generation, 4Q10-4Q16 (K Square meters/quarter)
Chart 3: Emerging display technology targets under China's 12th 5-year plan
Domestic TV demand and China's role as global TV production base
Chart 4: LCD TV shipment forecast in China, 2006-2016 (Million units)
Chart 5: China's LCD TV production and global share from 2008-2013 (K panels)
Chart 7: 8.5G TFT LCD capacity in China, 2011-2016 (K substrates/year)
Chart 9: BOE TFT LCD revenue growth by fab, 1H12-1H13 (CNY m)
BOE large-size panel shipments forecast by application, 2012-2016
BOE small- to medium-size TFT LCD panel shipments by application, 2012-2016
Chart 10: BOE shifts 6G production capacity to handset panel production
Chart 11: BOE LCD panel shipments by application from 2012-2016 (K panels)
BOE capacity expansion and worldwide market share, 2011-2016
Chart 13: BOE TFT LCD capacity forecast, 2011-2016 (K square meters/year)
Chart 14: BOE global TFT LCD capacity share by panel size, 2011-2016
Chart 17: Comparison of BOE and CSOT revenues and operating profit ratios by fab, 1H13 (CNY m)
CSOT capacity expansion and worldwide market share, 2011-2016
Chart 20: CSOT LCD capacity from 2011-2016 (K square meters /year)
Chart 21: CSOT government subsidies in non-current liabilities account from 2012-1H13 (CNY m)
Chart 25: Tianma, IVO and CEC revenue share by product, 2013
Capacity expansion plans of CEC Panda Display, Tianma and IVO
Table 3: Tianma Group's TFT LCD production capacity and technology by fab
Table 4: IVO's TFT LCD production capacity and technology by fab
Shipment forecasts for CEC Panda Display, Tianma and IVO, 2012-2016
Chart 26: CEC Panda TFT LCD shipments from 2012-2016 (K panels)
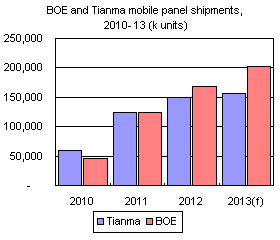
Chart 28: Tianma's TFT LCD shipments from 2012-2016 (K panels)
Revenue forecast for CEC Panda Display, Tianma and IVO, 2012-2016
Chart 29: Tianma,CEC Panda and IVO's revenue forecast, 2012-2016 (CNY m)
Chart 30: Tariff percentage on LCD panels issued by the China government, 2008-2010
Chart 31: Tariff percentage for LCD cell implemented in April 2012
Chart 32: Number of Taiwan engineers working for China panel makers
Chart 35: CSOT's government subsidies in non-current liabilities account from 2012-1H13 (CNY m)
Chart 36: Major panel makers in China continue to receive support from the China government
Chart 37: BOE's directional add-issuance financing since 2006 (CNY m)
Capacity expansion in China's flat panel display industry, 2013-2016
Chart 40: China region TFT LCD capacity forecast, 2011-2016 (K square meters /year)
Chart 41: China region TFT LCD capacity share by application forecast 2011-2016
Forecast of China region's large size TFT LCD capacity growth and global share, 2013-2016
Chart 42: China large-size TFT LCD capacity and share, 2013-2016 (K square meters)
Large size TFT LCD panel shipment forecasts in China, 2013-2016
Chart 43: China major panel makers' large-size LCD shipment forecast, 2013-2016 (K panels)
China's share of global large-size TFT LCD shipments, 2013-2016
Chart 44: China large-size TFT LCD global shipment share forecast 2013-2016 (K panels)
Small- to medium-size TFT LCD panel shipment forecast for top-4 makers in China, 2013-2016
Chart 46: China small- to medium-size TFT LCD global shipment share, 2013-2016 (K panels)
TFT LCD revenue forecast for China's FPD industry, 2013-2016
Chart 47: China major panel makers' revenue forecast 2013-2016 (CNY m)
Chart 48: China major TFT LCD panel makers revenue growth 2013-2016 (CNY m)

