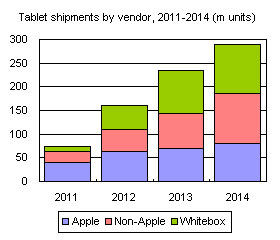
Digitimes Research estimates that in 2014 global tablet shipments will reach 289 million units. This report analyzes the main players, their strategies and shipments forecasts for 2014, as well as other factors contributing to either growth or decline in various segments within the tablet market, with a particular focus on Apple, Google, Samsung, and Microsoft, along with whitebox vendors. Moreover, the report discusses Taiwan tablet EMS/ODM makers and their shipment forecasts, along with their related market shares and shipment growth.
Device types defined by form factor, not hardware specifications
Table 1: Device definitions - notebooks, tablets, smartphones, portable media players
Chart 1: Mobile shipments by device type, 2007-2014 (m units)
Non-Apple and whitebox shipments both likely to reach 100 million units
Chart 2: Tablet shipments by vendor, including whitebox, 2011-2014 (m units)
Chart 3: Global Android tablet shipments, 2013-2014 (m units)
Chart 6: Branded tablet shipments by screen size, 2013-2014 (m units)
Chart 7: Branded tablet shipment share by screen size, 2013-2014 (m)
Chart 8: Branded tablet shipments by OS, 2013-2014 (m units)
Chart 10: Shipments of detachable type tablets, 2011-2014 (k units)
Chart 11: Apple has a more complete product line in 2013 and maintains a high pricing strategy
Chart 12: Apple tackles the smaller-size tablet market with its iPad retina display
Chart 13: Apple gross profits and on-year changes, 1Q12-2Q13 (US$m)
Chart 14: iPad mini with retina display will bring increased gross profits of US$13-20
Chart 15: iPad Air is thinner and may decrease potential iPad mini sales
Chart 16: iPad 2 pricing may help in sales with new iPad series
Chart 18: Shipment proportion of Apple tablets by product line, 2014
Chart 19: Samsung uses four main strategies for tackling the market
Chart 20: Price strategy for Samsung will be important for its shipments in 2014
Chart 21: 7-inch units will still be Samsung's main channel growth in 2014
Chart 22: Addressing Android fragmentation was a top priority for Google in 2013
Chart 24: Android tablet shipments from Google and other vendors, 2012-2014 (m units)
Chart 25: Kindle Fire business model focused around content and service
Chart 26: Kindle Fire HD has a US$20-30 premium over competitors
Chart 27: Kindle Fire HDX 7- and 8.9-inch target high-end Android products and iPad
Chart 29: Mayday real-time technology support expected to help bring in more customers
Chart 30: Notebook and tablet interface functions hard to combine
Chart 31: Products and customer demand lead to poor sales of Windows tablets
Chart 33: Surface 2 faces differentiation challenges from Lumia
Chart 34: Office becomes more integrated into mobile devices
Chart 36: Windows tablet shipment share by product, 2013-2014
Chart 37: Taiwan ODM/EMS tablet shipments and global share, 2011-2014 (m units)
Chart 38: Shipments by Taiwan ODM/EMS player, 2013-2014 (m units)
Chart 39: Share of Taiwan tablet shipments by ODM/EMS player, 2013-2014
Chart 40: Changes in entry-level brand and whitebox tablet pricing by processor, 2013 (US$)
Chart 41: Whitebox tablet AP shipment share by processor, 4Q12-4Q13
Chart 42: Whitebox tablet shipments and share of market, 2011-2014 (m units)
Chart 43: Whitebox tablet shipments by size and proportion, 2013-2014 (m units)

