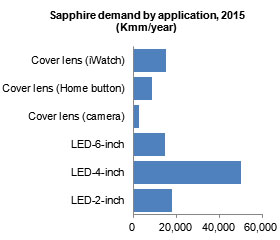
This Digitimes Research Special Report focuses on the 2014-2015 sapphire application market and industry outlook. Sapphire has been a key component in the LED industry in recent years, but demand is increasingly coming from lens cover applications in market segments including digital cameras, Home buttons on smartphones and most recently the Apple Watch.
Digitimes Research estimates that in 2015 annual growth for sapphire demand will hit 22.3% in the LED industry and 110.6% in the cover lens segment. This report analyzes trends in the sapphire industry that may affect demand supply balance, especially concerning the use of sapphire in the smartphone and smartwatch industries and price trends that can lead to the implementation of more cost-effective alternatives.
Chart 1: Sapphire demand by application, LED and cover lens, 2014, (Kmm/year)
Chart 5: Sapphire demand growth by application, 2014-2015 (Y/Y)
Chart 6: Change in sapphire demand share by application, 2014-2015 (percentage points)
Chart 8: Sapphire demand by application, LED and cover lens, 2014-2015 (Kmm/year)
Chart 9: Sapphire demand share by application, LED and cover lens, 2014-2015
Chart 10: Taiwan LED plant MOCVD equipment share by maker, 2014
Chart 13: Taiwan 4-inch LED wafer capacity, share by maker, 2014
Analysis of 4-inch LED wafer production by China-based makers, 2014
Chart 17: Greater China LED capacity breakdown by wafer size, 2014
Chart 18: Greater China 4-inch LED wafer capacity, share by maker, 2014
Chart 20: Sapphire crystal plant capacity share by maker, 2014
Chart 21: Global 2-inch MOCVD equipment share by region, 2014
Chart 22: Global 2-inch LED epitaxial wafer and sapphire ingot production capacity balance, 2014
Chart 23: Global 4-inch LED epitaxial wafer and sapphire ingot production capacity balance, 2014
Chart 24: Global 4-inch LED epitaxial wafer production capacity by geographic region, 2014
Chart 25: Global 2-inch sapphire ingot price, 1Q13-2H14 (US$/mm)
Chart 26: Global 4-inch sapphire ingot pricing, 1Q13-2H14 (US$/mm)
Chart 28: Sapphire required based on LED demand, by size, 2014-2015, (k substrate)
Chart 31: Taiwan PSS capacity, 2-inch equivalents, 1Q14-4Q14 (k wafers/month)
Chart 34: Greater China 4-inch PSS supply, 1Q14-4Q14 (k substrates/month)
Chart 35: Greater China 4-inch LED PSS demand, 1Q14-4Q14 (k substrates/month)
Chart 36: Greater China 4-inch PSS supply/demand gap, 1Q14-4Q14
Effects of increased LED capacity on sapphire and PSS industries in Greater China, 2015
Chart 40: Greater China 4-inch epitaxial wafer capacity share by region
Chart 41: Sapphire cover lens demand by application, 2013-2015 (m units)
Chart 42: 2-inch sapphire cover lens demand by application, 2013-2015 (k substrates)
Chart 43: 2-inch sapphire cover lens demand by application, 2013-2015 (k ingots)
Chart 44: 2-inch sapphire ingot cover lens demand share by application, 2013-2015
Total 2-inch cover lens sapphire ingot demand and market forecast
Chart 45: iWatch 2-inch sapphire ingot demand, 2013-2015 (Kmm)
Chart 46: Cover lens share of global sapphire market, 2014-2015
Table 1: iWatch sapphire crystal growth furnace capacity requirements, 2014-2015
Chart 47: Apple GTAT prepayment schedule (four quarterly payments)
Chart 49: GTAT capital expenditure forecast, 1Q13-2H14 (US$m)
Chart 51: GTAT sapphire business revenue forecast, 1Q13-2H14 (US$m)
Potential sapphire us e in smartphone screens by GTAT - Case analysis
Table 2: Sapphire shipment potential by GTAT for use in 5.5-inch smartphone screen cover, 2014
Table 3: GTAT potential 5.5-inch sapphire phone screen shipments, revenue analysis, (US$)
Price Comparison between 5.5-inch smartphone sapphire and glass screen protective layers in 2014
Chart 52: Pricing comparison for 5.5-inch smartphone screen cover applications (US$)
Sapphire smartphone screen capacity forecast and supply chain analysis - 2015
Table 4: GTAT's 5.5-inch sapphire smartphone screen cover capacity forecast, 2015
Table 6: 2015 Scenario analysis - sapphire ingot supply and demand situation (optimistic)
Table 7: Scenario analysis - sapphire ingot supply and demand situation (conservative)
Table 8: Major sapphire industry expansion projects in China
GTAT development of new technologies and increased sapphire production
Chart 53: Thickness of Hyperion cutting methods of sapphire (micrometers)
Chart 55: Production of 5.5-inch sapphire cover lenses by technology (k units/year)
Changes in sapphire smartphone screen prices and future price forecasts

