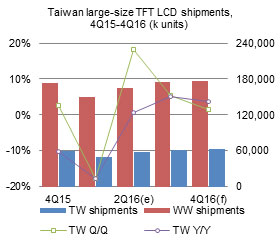
 Taiwan's large-size LCD panel makers saw meaningful recovery in their shipments in the second quarter of 2016. Compared to the same period a year ago, Taiwan's second-quarter 2016 shipments grew slightly by 0.8%, but it already represents the first on-year growth after five consecutive quarters of declines.
Table of contents
Chart 6: Worldwide shipments by application, 2Q15-4Q16 (k units)
Chart 7: Monitor panel shipments by maker, 2Q15-4Q16 (k units)
Chart 8: Notebook panel shipments by maker, 2Q15-4Q16 (k units)
Chart 9: Tablet panel shipments by maker, 2Q15-4Q16 (k units)
Chart 10: LCD TV panel shipments by maker, 2Q15-4Q16 (k units)
Chart 11: Monitor panel shipments by size, 2Q15-4Q16 (k units)
Chart 13: Notebook panel shipments by size, 2Q15-4Q16 (k units)
Chart 17: Taiwan large-size panel shipments and share of global market, 2012-2016 (k units)
Chart 19: Worldwide shipments by application, 2014-2016 (k units)