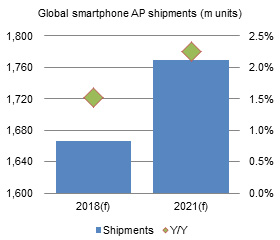
Digitimes Research estimates total shipments of smartphone application processors (AP) worldwide will grow 1.5% on year to 1.67 billion units in 2018. The slowing growth in the smartphone market means global smartphone AP shipments will only grow at a mild pace in the next few years, reaching 1.77 billion units in 2021, according to Digitimes Research's latest Special Report - Global AP market, 2017-2021, which provides insight into various aspects of the market.
Qualcomm will continue reigning at No. 1 in terms of vendor rankings in 2018, followed by MediaTek. While the top-2 AP vendors are unlikely to see threats of being unseated, in-house-developed chips by Apple, Samsung, and Huawei (Hisilicon) will see their share of shipments grow to almost 30% in 2018. Except for Samsung who sells to outside clients a small quantity of its in-house-developed chips, Apple and Hisilicon produce processors exclusively for use in their own smartphones - the iPhone for the former, and Huawei's devices for the latter. As they are the world's top-three smartphone vendors (Apple, Samsung and Huawei), their growing presence is creating strong pressure for processor vendors. It is estimated Qualcomm will show a 1.5% decline in total 2018 shipments. MediaTek's customer base does not overlap much with the device vendors using their own chips and MediaTek has introduced competitive mainstream processors which have been adopted by downstream smartphone vendors. As such, MediaTek is expected to see a 2.1% increase in 2018 shipments but it may have difficulty reaching its 2018 goal of shipping 400 million chips due to slowing growth in the smartphone end market.
In terms of processor architectures, Cortex-A53 remains the mainstream, followed by in-house-developed architectures. As to manufacturing process technologies, 28nm node is still the dominate node, maintaining a major share. The manufacturing of processors for flagship phones will advance to 7nm, 10nm and 12nm nodes, resulting in a drop of the 16nm node's shipment share. The 14nm node's shipment share will rise marginally as Samsung expands its adoption of in-house-developed APs.
Smartphone AP developers are scrambling to add deep learning capabilities to their offerings so that they can perform edge computing in line with the rising artificial intelligence (AI) trend. Smartphone APs supporting heterogeneous computing with graphics processing units (GPU), digital signal processors (DSP) or neural network processors are growingly popular. It is estimated 26.9% of smartphone AP shipments worldwide will have deep learning inference and even training capabilities enabled by heterogeneous computing in 2018.
Chart 1: Global smartphone AP shipments, 2016-2021 (m units)
Chart 6: Shipments by baseband technology, 2017-2018 (m units)
Chart 8: Shipments by manufacturing process, 2017-2018 (m units)
Chart 13: Qualcomm shipments by product series, 2017-2018 (m units)
Chart 14: Qualcomm shipment share by product series, 2017-2018
Chart 15: Qualcomm shipments by manufacturing process, 2017-2018 (m units)
Chart 16: Qualcomm shipment share by manufacturing process, 2017-2018
Chart 18: MediaTek shipments by product series, 2017-2018 (m units)
Chart 19: MediaTek shipment share by product series, 2017-2018
Chart 20: MediaTek shipments by manufacturing process, 2017-2018 (m units)
Chart 21: MediaTek shipment share by manufacturing process, 2017-2018
Chart 22: MediaTek smart speaker AP shipments, 2017-2018 (k units)
Chart 24: Apple shipments by product series, 2017-2018 (m units)
Chart 26: Apple shipments by manufacturing process, 2017-2018 (m units)
Chart 27: Apple shipment share by manufacturing process, 2017-2018
Chart 29: Samsung shipments by product series, 2017-2018 (m units)
Chart 30: Samsung shipment share by product series, 2017-2018
Chart 31: Samsung shipments by manufacturing process, 2017-2018 (m units)
Chart 32: Samsung shipment share by manufacturing process, 2017-2018
Chart 34: Hisilicon shipments by product series, 2017-2018 (m units)
Chart 35: Hisilicon shipment share by product series, 2017-2018
Chart 36: Hisilicon shipments by manufacturing process, 2017-2018 (m units)
Chart 37: Hisilicon shipment share by manufacturing process, 2017-2018
Chart 39: Spreadtrum shipments by product series, 2017-2018 (m units)
Chart 40: Spreadtrum shipment share by product series, 2017-2018
Chart 41: Spreadtrum shipments by manufacturing process, 2017-2018 (m units)
Chart 42: Spreadtrum shipment share by manufacturing process, 2017-2018

