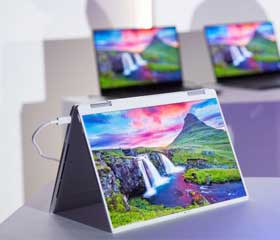
Notebook shipments in 2019 are estimated to increase 1.6% with vendors ramping up inventory in preparation for the US-China trade war and better-than-expected shipments for enterprise devices and Chromebook. But shipments in 2020 are expected to slip significantly due to the 15% US tariff on Chinese-made notebooks.
Global smartphone shipments will continue to decline in 2019. Although emerging markets are seeing users switching from feature phones to smartphones, it is taking longer for consumers in mature markets to upgrade their phones, resulting in the decline in overall smartphone shipments. Shipments in 2020 are estimated to rise thanks to 5G commercialization.
Global tablet shipments will continue declining and the volumes in 2020 are unlikely to be able to stay above 130 million units. After 2020, the tablet market will rely mainly on rigid demand with shipments declining 2%-3% every year through 2024 to stabilize at 120 million units.
Key factors affecting 2020-2024 worldwide smartphone shipments
Table 1: Key factors affecting 2020-2024 worldwide smartphone shipments
Chart 2: Top-10 smartphone vendors' shipments, 2019-2020 (m units)
Chart 5: Global smartphone shipment forecast, 2019-2024 (m units)
Chart 6: Global shipments by 5G and non-5G, 2019-2024 (m units)
Key factors affecting 2020-2024 worldwide notebook shipments
Table 2: Key factors affecting 2020-2024 worldwide notebook shipments - supply side
Table 3: Key factors affecting 2020-2024 worldwide notebook shipments - demand side
Chart 7: Global notebook shipment forecast, 2017-2024 (m units)
Table 4: Key factors affecting 2020 worldwide notebook shipments - supply side
Table 5: Key factors affecting 2020 worldwide notebook shipments - demand side
Table 6: Shipment performance of major notebook brands in 2020
Chart 8: Notebook shipments by top vendor, 2018-2020 (m units)
Table 7: Key factors affecting worldwide tablet shipments from 2020-2024
Chart 10: Shipments by brand and white-box player, 2015-2020 (m units)
Chart 13: Brand shipments by touchscreen technology, 2019-2020 (m units)
Chart 14: Brand shipment share by touchscreen technology, 2019-2020

