


World-leading PC brand MSI hosts virtual events to unveil the MSI-VERSE and the latest innovations for the 2022 Consumer Electronics Show. The online events allow MSI to provide consumers with an immersive and interactive experience beyond the limitations of distance and time.
MSI Vice President of Marketing Sam Chern said, "The mystery of the origins of the universe, time, and space have always spurred our interest. With the help of aesthetics and science, we can begin to understand these mysteries. Combining aesthetics and technology to make cutting-edge products has always been our mission and core value. As a premium brand, MSI has continuously evolved its gaming and creator series lines to the next level. MSI infuses different domains, including aesthetics, science, and music, to create a strong immersive atmosphere, which expresses and even stimulates our understanding of the universe, leading us into a new era of the metaverse. By making best-in-class products for gamers and content creators, MSI is ready to help users go beyond their limits. No matter if you are a 2D or 3D designer, VR user, or building your own metaverse, you will find high-quality, low-latency performance in all of our selections."
MSI-VERSE
MSI-VERSE consists of three series: Gaming, Content Creation, and Business and Productivity. Users can explore the latest hardware & software solutions, join streaming activities, play games, earn virtual coins, and get a chance to win grand prizes in an immersive and interactive way through the MSI-VERSE.
MSI latest products and innovations for CES 2022 include:
MSI Stealth GS77 Gaming Laptop
Stealth GS77 is armed with the latest 12th Gen. Intel Core i9 processors and powered by NVIDIA GeForce RTX 30 series graphics. Supreme performance with ultra-lightweight design, the Stealth GS series brings infinite possibilities for businesspeople-slash-gamers. Highlights include the Phase Change Liquid Metal Pad, 99.9Whr capacity battery and Wi-Fi 6E.
MSI Raider GE76 Gaming Laptop
Raider GE76's ultra-high performance and solid build provide a gaming experience beyond the limitations of space. Equipped with the latest 12th Gen. Intel Core i9 processors, NVIDIA GeForce RTX 30 series graphics and the Phase Change Liquid Metal Pad, Raider GE76 incarnates like a spaceship soaring through the boundless space. The Raider GE76, which represents the concept of MSI's continuous evolution, will lead gamers in their exploration of the unknown universe!
MSI Crosshair 15 Rainbow Six Extraction Edition Gaming Laptop
MSI has teamed up with Ubisoft's Tom Clancy's Rainbow Six Extraction to release the all-new limited Crosshair 15 Rainbow Six Extraction Edition. Unknown forces are invading, and the user is the last hope for mankind. They are armed with the discreetly developed advanced gaming weapon - Crosshair 15 Rainbow Six Extraction Edition. Equipped with up to the latest 12th Gen. Intel Core i9 processor and NVIDIA GeForce RTX 30 series graphics, get ready to aim, fire, and retake your position!
MSI MEG Aegis Ti5 Gaming Desktop
Setting the trends of the future and breaking through the traditional gaming machine concept, MSI MEG Aegis Ti5 will bring a new user experience. Inheriting the Aegis series' avant-garde design, the MEG Aegis Ti5 is even more futuristic. MSI designed the exclusive Gaming Dial, so users can view the status of Aegis Ti5 from the front panel. Moreover, MEG Aegis Ti 5 12th features the latest 12th Gen Intel Core processors, and the latest NVIDIA GeForce RTX 3090 graphics card, so 3A games can run smoothly. Built with the latest technology, the all-new MEG Aegis Ti5 allows players to explore the new era.
MSI MAG Trident S 5M Cloud Gaming Desktop
MSI MAG Trident S 5M Cloud Gaming Desktop offers true immersion in cloud gaming with just one gaming controller. Through the exclusive "Game Stadium" application, gamers will enjoy cloud gaming, mobile games, PC games, and more on different platforms in the Windows system with one controller. And last but not least, there's a variety of entertainment software that awaits users to continue the fun!
MSI Optix MPG321UR-QD Gaming Monitor
Optix MPG321UR-QD gets users ready for the next level of gaming. The best solution for console gaming and PC gaming at 144Hz at 4K resolution, the Optix MPG231UR-QD is the experience users deserve.
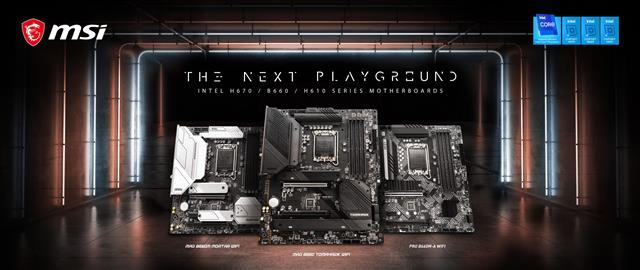
MSI Intel H670 / B660 / H610 Series Motherboards
The latest Intel H670 / B660 / H610 Series motherboards provide both DDR5 and DDR4 versions to meet the demands of all users. The new motherboards feature mighty power phases up to 14 Duet Rail Power System, Memory Boost, and optimized thermal solutions which guarantee system stability along with high performance. The latest specifications such as 2.5G LAN, Wi-Fi 6E, and USB 3.2 Gen2 x2 are included to further improve the experience for gamers.
MSI Intel H670 / B660 / H610 Series Motherboards
MSI's motherboard and PC case cooperate with EK
MSI and EK released their first jointly-commissioned cooling part, debuting in early 2022. Designed in partnership with EK, MSI MEG PROSPECT 700 Series can install the EK-Quantum Reflection2 MEG Prospect 700R PWM D-RGB – Plexi and the MPG Z690 CARBON EK X and MAG Z690 TORPEDO EK X motherboard. It is a dream rig for the next generation.
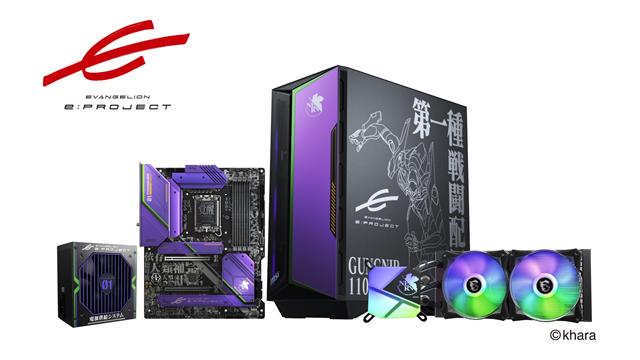
MSI x EVANGELION e:PROJECT Co-branding Edition
MSI is also excited to partner with EVANGELION e: PROJECT to announce a collaboration for a motherboard, liquid cooler, power supply, and PC case. EVANGELION e: PROJECT is an e-sports brand that incorporates the world of EVANGELION. The design adopts the appearance of the Evangelion Unit-01, with its iconic purple and green color scheme that is worthy of helping DIY users build their own iconic Evangelion-inspired gaming system.
EVANGELION e: PROJECT
MSI SUPRIM Graphics Card
The MSI SUPRIM X graphics card intertwines performance and prestige in a culmination of decades of advanced circuit design and cooling development.
MSI SPATIUM M480 PLAY SSD
MSI SPATIUM M480 PCIe 4.0 NVMe M.2 PLAY sports a sleek black aluminum heatsink that was designed for use with the PS5. With a lower profile, the new dual-finish heatsink ensures maximum performance across all gaming platforms. Compliance with PCIe Gen 4 and NVMe 1.4 standards unleashes extreme sequential read speeds up to 7000MB/s.
MSI GK71 Sonic Gaming Keyboard
MSI GK71 Sonic Keyboard is a mid to high-end gaming keyboard that aims to enhance the user's experience by focusing on comfort, practicality, and aesthetics. The exclusively-developed MSI Sonic Red mechanical switches so gamers can achieve "Light Touch, Instant Kill."
MSI IMMERSE GH50 WIRELESS Headset
MSI Immerse GH50 Wireless is MSI's first wireless gaming headset utilizing a small form-factor ceramic antenna to provide ultra-low latency, expanded wireless range up to 65ft (20m), a premium immersive 7.1 spatial audio experience with 50mm neodymium drivers, and an advanced software application.
MSI IMMERSE GV60 STREAMING MIC
MSI Immerse GV60 Streaming Mic, MSI's first streaming microphone, brings the studio anywhere by incorporating all the core features streamers and content creators want – high-resolution sample rate, versatile pickup patterns, and real-time monitoring in a sleek matte-finished aluminum design. Product available in early Q1 2022.
MSI Modern DM10 Desktop
The MSI Modern DM10 desktop PC pushes the boundaries of computing performance with incredible speed and intelligence. Designed with professionals in mind, the Modern DM10 brings users a powerful professional experience with technologies such as Neural Noise Suppression, audio background blur, video super-resolution support, and the latest in video codecs to foster productivity and add efficiency to critical tasks.
MSI Creator Z16P Laptop
Through the beauty formed by the "Golden Ratio", the new Creator Z16P applies even more advanced technology than the last generation. It comes in a gorgeous Lunar Gray and CNC uni-body chassis with the latest 12th Gen. Intel Core i9 processor performance, up to the 16:10 golden ratio Display, pen support option, and smart vapor chamber cooling.
MSI Creator Z17 Laptop
The Creator Z17 is the 1st 17-inch Pen Touch Laptop in the world, and comes in CNC uni-body chassis with the latest 12th Gen. Intel Core i9 processor performance. The 16:10 golden ratio Pen touch display and Trinity+ cooler boost that define the experience of Technology Meets Aesthetic.
Personalized Your Surround Sound, Match Your Uniqueness
MSI's selected laptop speakers have been further optimized with Nahimic Audio by SteelSeries. Nahimic innovative surround sound personalization feature is designed to adapt to all types of ears and heads, thanks to a dynamic adjustment of the sound waves. Users can simply listen and choose one profile that fits their needs. Sound perception is forever changed.
Laptop Launch Event – MSIOLOGY: MSI GAMEVERSE
Date: Jan 4th 13:00PM PST
Location: https://msi.gm/MSIology2022
Virtual Event: MSI-VERSE:
Date: Jan 5th 10:00AM PST
Location: https://msi.gm/msi-verse2022
