Approximately 178 million handsets will have AMOLED panels this year and the number will increase to 465 million by 2014. While AMOLEDs are becoming increasingly popular, production remains a concern and is dominated by Korean makers, with Samsung's SMD dominating the small- and medium size market and LGD set to lead the market for large-size OLED TV panels. This Special Report compares and contrasts the different technologies used by industry players, as well as looking at the developments and plans of makers in Japan, Taiwan and China.
SMD in-house developed SGS an alternative to laser annealing
Chart 4: Process flow of traditional laser annealing compared with SGS
Companies gearing up for large-size AMOLED displays, and new fabrication technologies
Metal oxide TFTs gain cost advantage with the use of existing a-Si TFT-LCD lines
Table 4: Comparison of a-Si, IGZO and LTPS TFT specifications
Chart 6: Comparison of WOLED-CF and RGB AMOLED specifications
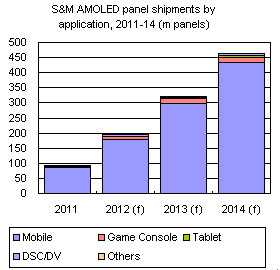
Chart 7: Small- to medium-size AMOLED panel shipments by application, 2011-14 (m)
Smartphone panel market: Competition between AMOLED and TFT LCD to become more intense
Chart 8: Comparison between RGB and PenTile Matrix sub-pixel arrangements
More players enter AMOLED market; Increase in capacity to stimulate penetration in smartphones
Chart 9: Global handset AMOLED shipment forecast, 2011-14 (m units)
Chart 10: Global non-handset use AMOLED shipment forecast, 2011-14 (m panels)
Chart 11: Market for large-size OLED TV above 50 inches kick off in 2012
Chart 12: Required capex for LGD 8.5G line LCD line, by technology (US$b)
Chart 13: Korea firms OLED monthly panel production capacity at 8.5G lines (k substrates)
Chart 16: Global AMOLED capacity share by region, 2011-15 (km2)
Chart 17: Yield rates for above-40-inch OLED TV panels, 2012-15
Chart 18: ASP for 55-inch OLED TVs (assuming 90% of shipments are 3D type) (US$)
Chart 19: Pricing forecast for 55-inch 3D OLED TVs, 2012-15 (US$)
Chart 20: Price outlook for 55-inch non-3D OLED TVs, 2012-15 (US$)
Chart 21: Global above 40-inch OLED TV shipments, 2012-15 (k units)
Table 6: SMD AMOLED capacity and business outlook (2012-2015)
Table 7: LGD AMOLED capacity and business outlook, 2012-2015
Table 8: Current capacity and outlook of Taiwan AMOLED makers, 2012-2015
Table 9: Current capacity and outlook of China AMOLED makers, 2012-2015
Chart 26: Japan AMOLED industry development prior to formation of Japan Display
Table 10: Japan Display AMOLED capacity and business outlook (2012-2015)
Table 11: Global AMOLED companies latest business development and strategies
Chart 28: Distribution of global small molecule and polymer OLED materials suppliers
Chart 29: Korea self-sufficiency rates of AMOLED manufacturing equipment (based on amount)
Table 12: SMD, LGD investment in OLED production equipment makers
Chart 32: Mainstream flexible substrates and Japan-based suppliers at a glance
Chart 33: Flexible AMOLED display development at Japan and Korea firms
Chart 35: Flexible AMOLED display structure and applications

