This Digitimes Research Special Report outlines the key factors in the rapid growth of the touch-panel industry in Greater China in recent years, as well as the technology trends and industry relationships that will affect touch panel makers moving forward. The report provides forecasts through 2015 for Greater China touch panel shipments with breakdowns based on technology (glass, film, resistive), application (smartphone, NB and tablet) and by firm.
Chart 1: Touch panel shipments by area for handsets, 2011-2015 (k square meters)
Chart 2: Touch panel shipments by technology for handsets, 2012-2015 (k units)
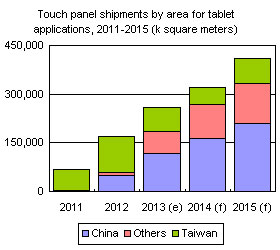
Chart 3: Touch panel shipments by area for tablets, 2011-2015 (k square meters)
Chart 4: Touch panel shipments by technology for tablets, 2011-2015 (k units)
Chart 5: Touch panel shipments by area for notebooks, 2012-2015 (k square meters)
Chart 6: Touch panel shipments by technology for notebooks, 2012-2015 (k units)
Chart 9: Innolux/GIS touch panel shipments, 2011-2015 (k units)
Chart 10: J Touch and Young Fast touch panel shipments, 2011-2015 (k units)
Chart 14: Mutto and Top Touch touch panel shipments, 2012-2015 (k units)
Chart 15: Greater China touch panel shipments for handsets, 2012-2015 (k units)
Chart 16: Taiwan touch-panel shipments for handsets by company, 2011-2015 (k units)
Chart 17: China touch-panel shipments for handsets by company, 2012-2015 (k units)
Greater China touch panel shipments for tablets by technology, 2014
Chart 18: Greater China touch panel tablet shipments by technology, 2012-2015 (k units)
Chart 19: Greater China touch panel tablet shipments by firm, 2012-2015 (k units)
Greater China touch panel notebook shipments by technology, 2014
Chart 20: Greater China touch panel NB shipments by technology, 2012-2015 (k units)
Chart 21: Greater China touch panel notebook shipments by firm, 2012-2015 (k units)

