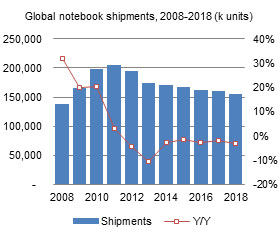
According to Digitimes Research, global notebook shipments will decline by 2.7% in 2014 to 170 million units and shipment totals in 2015 will continue to show a decline. While the business notebook market benefited from the expiration of support by Microsoft for Windows XP early in 2014, this trend will not maintain momentum into 2015. Moreover, more businesses are opting for tablets, and while Windows 10 is scheduled for release in the second half of 2015, it will not bring about market growth.
Shipments in 2015 will decline by 1.7%, reaching only 167 million units. Looking forward over the next few years through 2018, Digitimes Research expects a continued slight but steady decline in notebook shipments, with market demand totaling 154.7 million notebooks in 2018.
This Digitimes Research Special Report examines the key trends that will affect the notebook market in 2015, namely the ongoing drop in notebook prices being driven by Google and its Chromebook platform, and Microsoft's countermeasure through its Bing SKU and Small Screen Touch (SST) reduced royalty projects. Moreover, the notebook market will also face more competition from the tablet market, as tablets trend to larger sizes and Apple and Intel push strategies that promote tablets.
Device types defined by form factor, not hardware specifications
Table 2: Microsoft and Google low-price notebook strategies by size, 2014
Microsoft reduced-royalty low-cost notebook shipments, 2014-2015
Chart 3: Microsoft low-cost notebook shipments, 2015-2015 (k units)
Chart 4: Tablet shipments in three key market segments, 2013-2015 (k units)
Table 5: Google Chromebook strategy, by device size, 2014-2015
Chart 10: Chromebook shipments by major vendors, 2013-2015 (k units)
Chart 11: Microsoft low-cost notebook shipments by vendor, 2014-2015 (k units)
Chart 12: Digitimes Research prediction for Apple 2015 mobile computing strategy
Chart 13: Forecast of 2015 Apple mobile shipments, share by product
Chart 14: Taiwan notebook shipments, by ODM, 2013-2015 (k units)
Chart 15: Taiwan notebook shipments and global market share, 2011-2015 (k units)
Chart 16: Taiwan notebook shipments by ODM tier, 2011-2015 (k units)
Table 8: ODM/vendor notebook shipment matrix, 2015 (k units)
Chart 17: Taiwan top-five ODM notebook shipments, 2012-2015 (k units)
Chart 18: Quanta notebook shipments by client, 2012-2015 (k units)
Chart 19: Compal notebook shipments by client, 2012-2015 (k units)
Chart 20: Wistron notebook shipments by client, 2012-2015 (k units)
Chart 21: Inventec notebook shipments by client, 2012-2015 (k units)
Chart 22: Pegatron notebook shipments by brand clients, 2012-2014 (k units)

