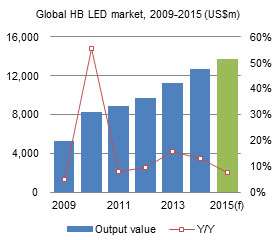
Digitimes Research forecasts that in 2015, the global high-brightness (HB) LED industry will have annual growth of 7.5% in terms of output, reaching US$13.7 billion. The total number of LEDs used will reach 186 billion units, representing annual growth of 32.6%, out of which lighting applications will have the highest annual growth rate in terms of usage, reaching 65%.
From the perspective of LED usage distribution, in 2015, lighting applications will account for up to 49.3% of LED usage, representing growth of 9.9 percentage points (pp) compared to 2014. Of the LEDs used in lighting applications 37.4% will be used for public LED tubes. Furthermore, the prices for LED light bulbs will drop, and these types of light sources will account for 32.5% of the LEDs used in lighting applications.
LED light source categories whose usage rates will decline due to drops in end-user device demand in 2015 include tablets, notebooks, and monitors. Due to the effects of large-screen mobile phones as well as consumers allocating budgets to buying smartwatches, it is forecast that in 2015, the amount of LEDs used for tablets will see an annual decline of 9.8%, making it the application category of backlit LED displays with the largest decline.
In response to increased demand for LEDs in 2015, upstream equipment vendors also have plans to expand production capacity, out of which China-based LED chip vendors are being the most aggressive. Based on LED epitaxy plant expansion plans for 2015, Digitimes Research calculates that global shipments of LED MOCVD equipment in 2015 will reach 252 units, growing by 10.5% compared to the 228 units shipped in 2014, with the highest demand coming from China-based vendors, accounting for 73.8% of global demand (higher than the 63% of 2014). The primary reason for this is because the China government is continuing to provide subsidiaries in 2015 and because many vendors are turning to the China's supply chain to purchase LED components for low-price lighting products.
Chart 3: LED shipment share by lighting application, 2014-2015
Table 1: TV LED backlight architecture development trends, 2015
Chart 4: HB LED shipments by application, 2013-2015 (m units)
Table 2: Factors for changes in shipment volumes of HB LEDs by application, 2014-2015
Chart 7: Shipment share for HB LEDs by application, 2014-2015
Chart 8: Shipment share changes for HB LEDs, by application, 2014-2015
Chart 9: Shipment share for HB LEDs by application, 2009-2015
MOCVD equipment capacity expansion plans for Mainland China's primary LED vendors for 2015
Chart 11: MOCVD capacity expansion for China's main LED vendors in 2015 (units)
Chart 12: Forecast share of new MOCVD equipment purchased by China LED vendors in 2015
Chart 13: Demand forecast for MOCVD equipment by region, 2015
Chart 16: Asia revenue proportion for Veeco and Aixtron, 2012-2014
Chart 20: Share of installed global MOCVD equipment by region, 2015
Chart 21: Changes in share of installed global MOCVD equipment by region, 2014-2015
Chart 22: Average luminous efficacy for 60W-equivalent LED light bulbs, 2013-2015 (lm/W)
Chart 23: 60W-equivalent LED light bulb distribution by efficiency, 2012-2015 (lm/W)
Chart 24: Global brand LED light bulbs, lumens-per-unit price, 2012-2015 (lm/US$)
Chart 25: Global population distribution by region, (Total of 7.06 billion)
Chart 26: GDP per capita of six most populous global regions, 2013 (US$)
Chart 27: Global LED light bulb shipments, 2011-2015 (m units)
Chart 28: Global LED light bulb market penetration rate, 2011-2015
Chart 29: Luminous efficacy for commercial high-end LED tube lights, 2013-2016 (lm/W)
Chart 30: Average pricing for 4-foot T8 LED tube lights, 2011-2015 (US$)
Chart 31: Global LED tube light market demand, 2011-2015 (m units)
Chart 32: Global LED tube light market penetration rate, 2011-2015
Chart 33: Global LED spotlight market demand, 2011-2015 (m units)
Chart 34: Global LED spotlight market penetration rate, 2011-2015
Table 3: Overview of LED street light adoption rates by global region
Chart 35: Global LED street light shipments, 2011-2015 (k units)
Chart 36: Global LED lighting market and penetration rates, 2009-2015 (m units)
Chart 37: Japan LED lighting market scale and penetration rate, 2012-2015 (US$m)
Chart 38: US LED lighting market scale and penetration rate, 2012-2015 (US$m)
Chart 39: Europe LED lighting market scale and penetration rate, 2012-2015 (US$m)
Chart 40: China LED lighting market scale and penetration rate, 2012-2015 (US$m)
Chart 41: Russia LED lighting market scale and penetration rate, 2012-2015 (US$m)
Chart 42: India LED lighting market scale and penetration rate, 2012-2015 (US$m)
Chart 45: Global LED lighting market share by region, 2013-2015
Chart 46: Changes in LED lighting market share by region, 2014-2015

