


Asustek Computer and Micro-Star International (MSI) both saw shipments of their high-margin gaming notebooks hit record highs in 2020, with the strong shipment momentum set to carry on in the first half of this year, according to industry sources.
Spurred by demand amid COVID-19, global notebook shipments were stronger-than-expected, with an estimated increase of at least 20% compared to 2019, exceeding 200 million units for the first time, the sources said.
The strong demand amid components shortages has significantly weakened the price war among major notebook vendors. The pandemic has also changed the competition between gaming notebook vendors, with the top-2 gaming notebook vendors, MSI and Asustek, expanding their market leaderships over competitors, the sources said, adding the gaming notebook market has returned to a two-horse race.
The first half of 2021 will see a boost from the launch of Nvidia's GeForce RTX 30 series for notebooks, and a number of new notebooks will be launched at the end of January, making first-quarter is 2021 the strongest off-season in years, the sources said.
The new wave of demand for applications supporting work and study from home, and e-sports games has been unrelenting, and notebooks are experiencing a frenzied surge in shipments not seen in years, the sources said.
MSI and Asustek are estimated to have shipped 1.4 million-1.45 million gaming notebooks to the above US$899 segment, up more than 30% to 40% compared to 2019. According to Nvidia, at least 70 models of GeForce RTX 30 series gaming notebooks will be launched, with prices starting at US$999.
Among them, MSI's first wave of 13 models, starting from as low as US$1,699 to as high as US$3,000, are equipped with GeForce RTX 3080 and Intel Core i9 processors, as well as the high-end GE76 Raider Dragon Edition model with Wi-Fi 6E.
The sources also pointed out that due to the prices for driver ICs, VRAM and other components have risen due to tight supply, and along with rising shipping costs, notebook suppliers are expected to increase prices.

MSI launched 13 new gaming notebooks
Photo: Monica Chen, Digitimes, January 2020
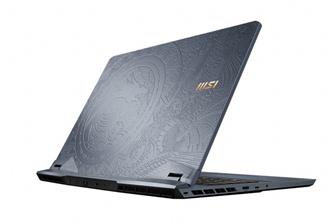
MSI GE76 Raider Dragon Edition notebook
Photo: Company
