DRAM contract prices have risen at a slower pace in the third quarter, and are expected to stay flat or drop slightly in the fourth quarter, according to industry sources.
The article requires paid subscription. Subscribe Now
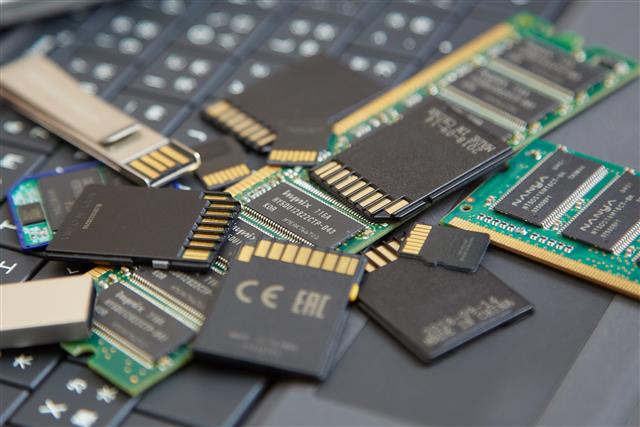
DRAM contract prices have risen at a slower pace in the third quarter, and are expected to stay flat or drop slightly in the fourth quarter, according to industry sources.
